
Solar energetic electron (SEE) events are strong enhancements of high-energy electrons associated with solar flares and coronal mass ejections (CMEs). These particles have speeds that are a large fraction of the speed of light, and we can measure them with spacecraft in the inner heliosphere. The mechanisms proposed to explain the origin of SEE events include acceleration during magnetic reconnection processes associated with solar flares and/or acceleration at shocks driven by fast CMEs, which often happen almost at the same time.
Many efforts have been made to identify, which of the proposed accelerators is responsible for SEE events. Therefore correlations have been analysed between SEE parameters, especially their peak intensity, and the properties of the associated solar activity phenomena, such as the X-ray flare peak intensity, CME speed and width, and CME-driven shock speed. These studies are mainly based on measurements near 1 astronomical unit (1 au = 150 million kilometres, i.e., Earth’s distance from the Sun), but particle propagation through the interplanetary space affects SEE properties at such distances from the Sun. Therefore, the observation of SEE events by spacecraft located closer to the Sun and the acceleration site is essential in order to infer the mechanisms associated with their acceleration.
A team led by Laura Rodriguez-García and participated by several other SERPENTINE scientists studied the relationship between the solar eruption (flare, CME, CME-shock) and the properties of the related SEE events measured by NASA/MESSENGER mission near 0.3 au. Using multi-spacecraft optical by the two STEREO spacecraft and SOHO we reconstructed the three-dimensional structure of the CMEs and CME-driven shocks associated to the observed SEE events. These multi-point observations allowed us to study the relations between the solar-eruption parameters and the peak intensity and energy spectrum of SEE events closer to the Sun.
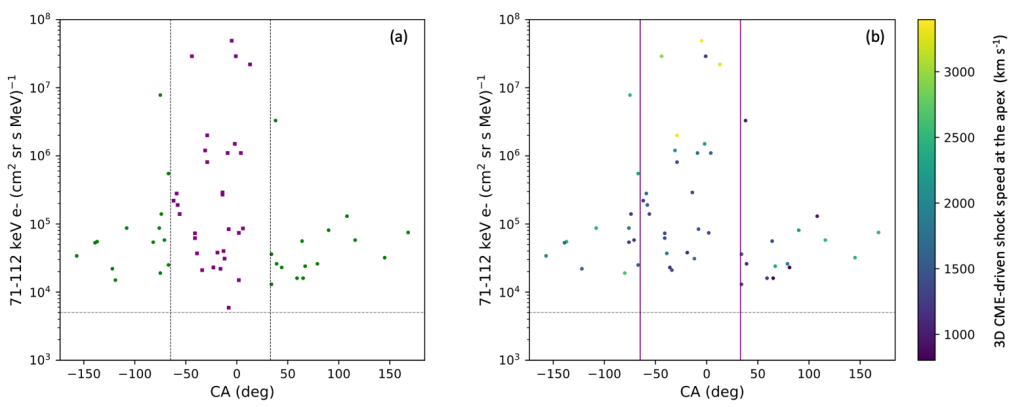
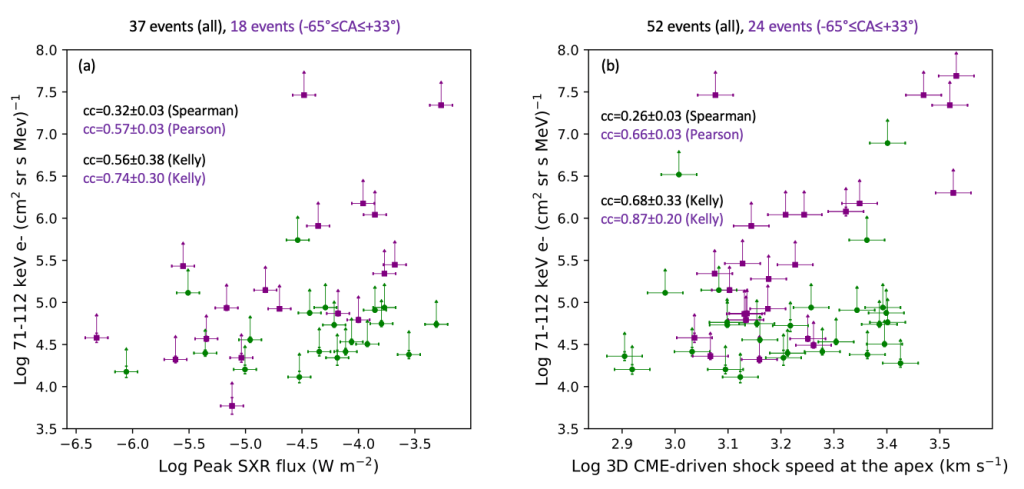
One important parameter in SEE event studies is the connection angle (CA), which is the longitudinal difference between the flare site and the footpoint of the interplanetary magnetic field line connected to the observer. We defined a subsample of well-connected events as when –65° ≤ CA ≤ +33°. For this well-connected sample, we find moderate to strong correlations between the near-relativistic electron peak intensity and various activity phenomena. When including poorly connected events (full sample), the relations become more blurred, showing lower correlation coefficients (see Fig. 2).
Based on the comparison of the correlation coefficients using near 0.4 au data by MESSENGER, we conclude that (1) both flare and shock-related processes may contribute to the acceleration of near-relativistic electrons in large SEE events, in agreement with previous studies based on near 1 au data; and (2) the maximum speed of the CME-driven shock is a better parameter to investigate particle-acceleration-related mechanisms than the average CME speed, as suggested by the stronger correlation with the SEE peak intensities.
For more details, see:
Rodríguez-García, L., Gómez-Herrero, R., Dresing, N., et al. 2023, A&A, 670, doi:10.1051/0004-6361/202244553
Rodríguez-García, L., Balmaceda, L.A.. Gómez-Herrero, R., et al. 2023, A&A, doi:10.1051/0004-6361/202245604