Here we present the tools created within the SERPENTINE project. They are available from the general SERPENTINE repository at GitHub, and can also be run on the SERPENTINE Hub server without the need to install Python locally.
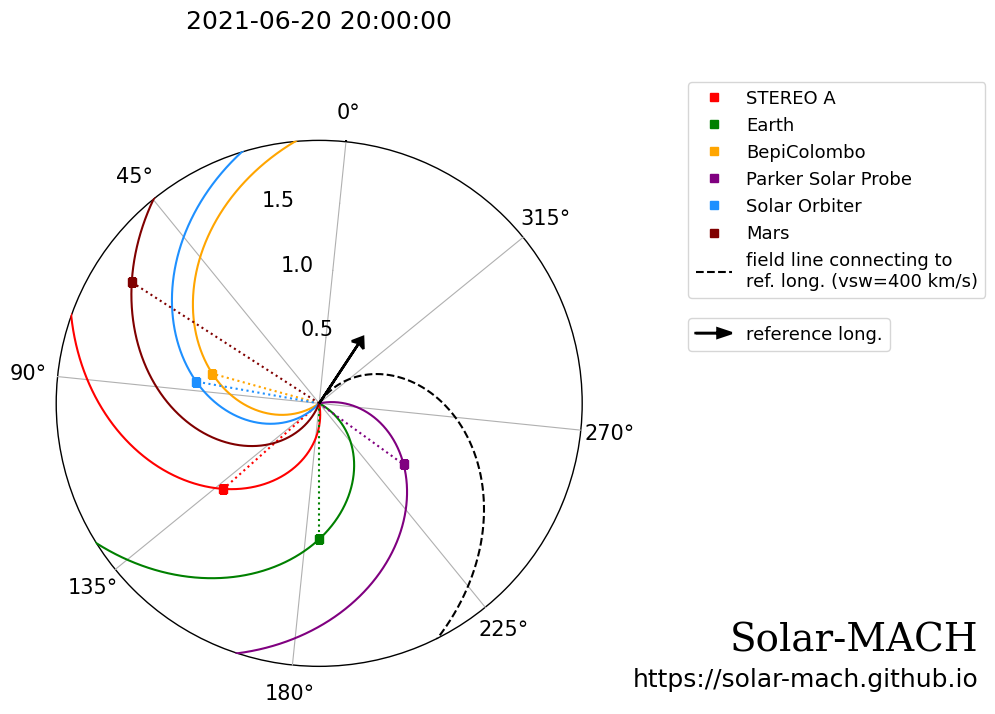
Solar-MACH is a hassle-free web app that displays the spatial configuration and magnetic connection of the spacecraft fleet in the inner heliosphere for a given time. With the option to freely add a reference coordinate at the Sun (e.g., flare location) and providing detailed information on coordinates and separation angles, it allows a quick start of an event analysis.
In addition to the web version, a Jupyter Notebook is provided that is offering more functionalities and ways to interact with Solar-MACH in a “pythonic” way. For example, it allows an easy implementation of an PFSS model to extend the magnetic connectivity to the photosphere, or gives an example on how to create a movie out of daily Solar-MACH constellation plots.
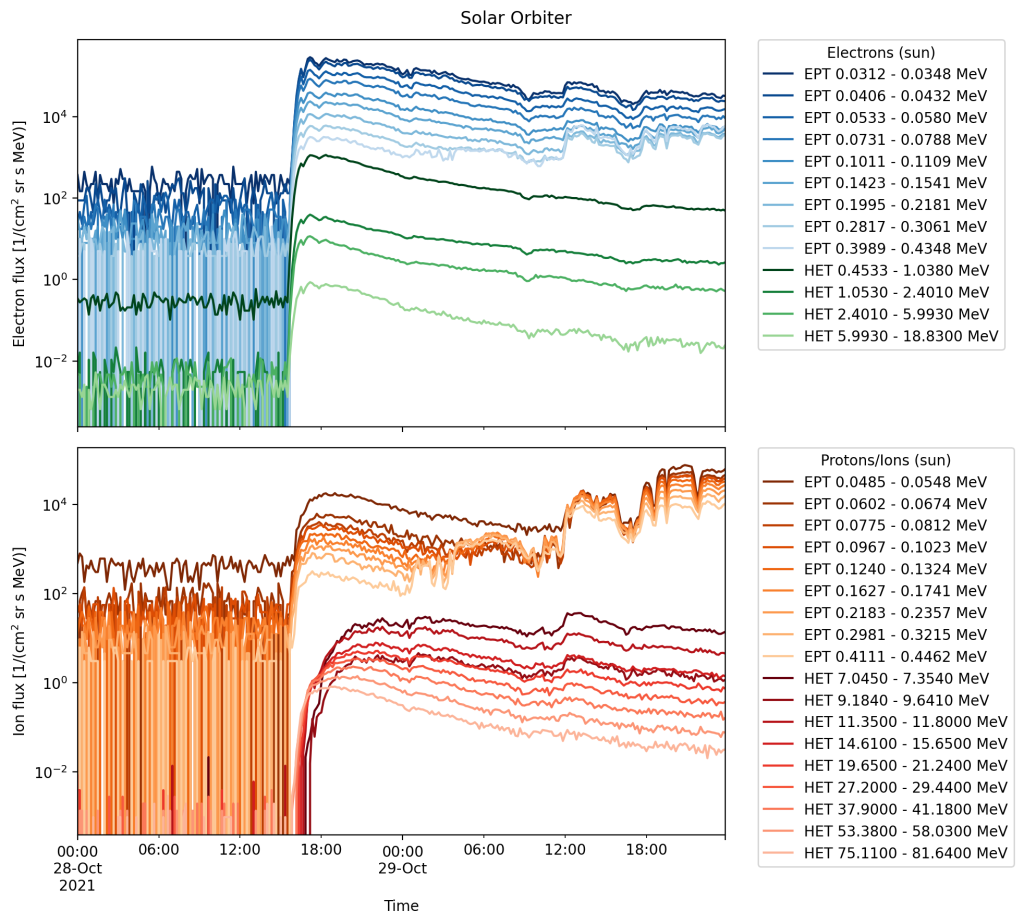
The Energetic Particle Data Loaders Notebook is a collection of functions that simplifies obtaining (i.e., automatically downloading and loading into Python structures) SEP data sets measured by the current heliospheric spacecraft fleet. This is especially valuable because the data products of the newest spacecraft like Solar Orbiter or Parker Solar Probe are only released in a binary data format that needs programming skills to read just the basic data.
In addition, the Notebook provides already different examples on how to visualize these data with Python. Versed users can then easily build their own analyses based on this.
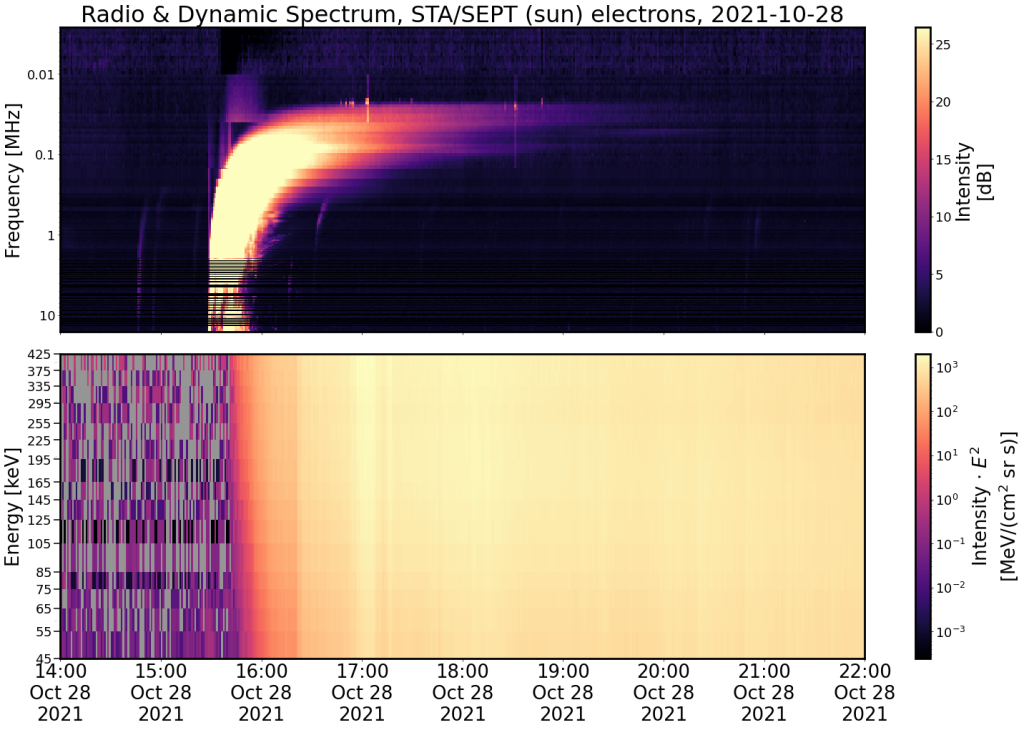
A dynamic spectrum plotter for different charged particle species measured by the current heliospheric spacecraft fleet and radio observations.
It offers an easy-to-use interface for selecting the mission, instrument, viewing direction, and particles species of interest, for which all needed data are automatically obtained and optionally resampled. In addition, radio observations can be plotted on top that are also downloaded automatically.
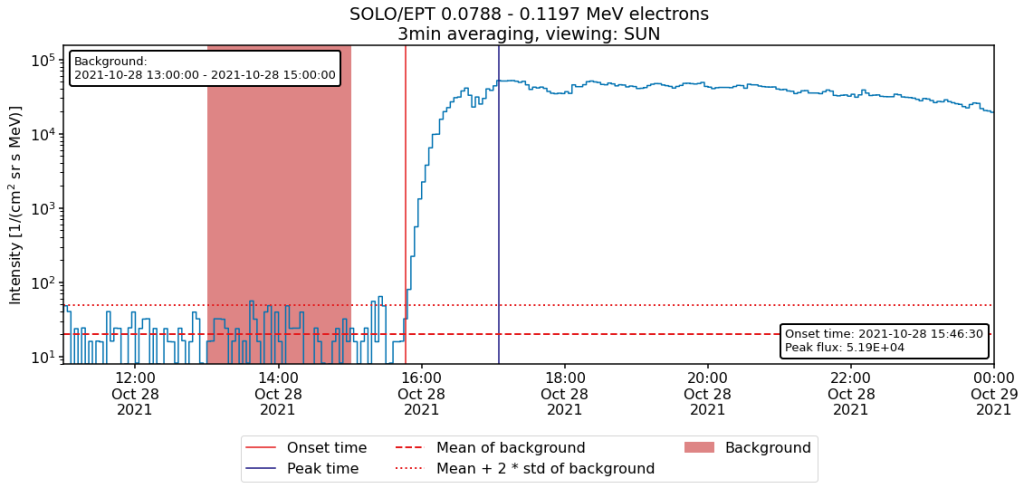
This notebook uses the established Poisson-CUSUM method to automatically derive the onset times of an SEP event.
It offers an easy-to-use interface for selecting the mission, instrument, viewing direction, and particles species of interest, for which all needed data are automatically obtained and optionally resampled. The only real input needed from the user is selecting the analysis time period and defining the pre-event background.
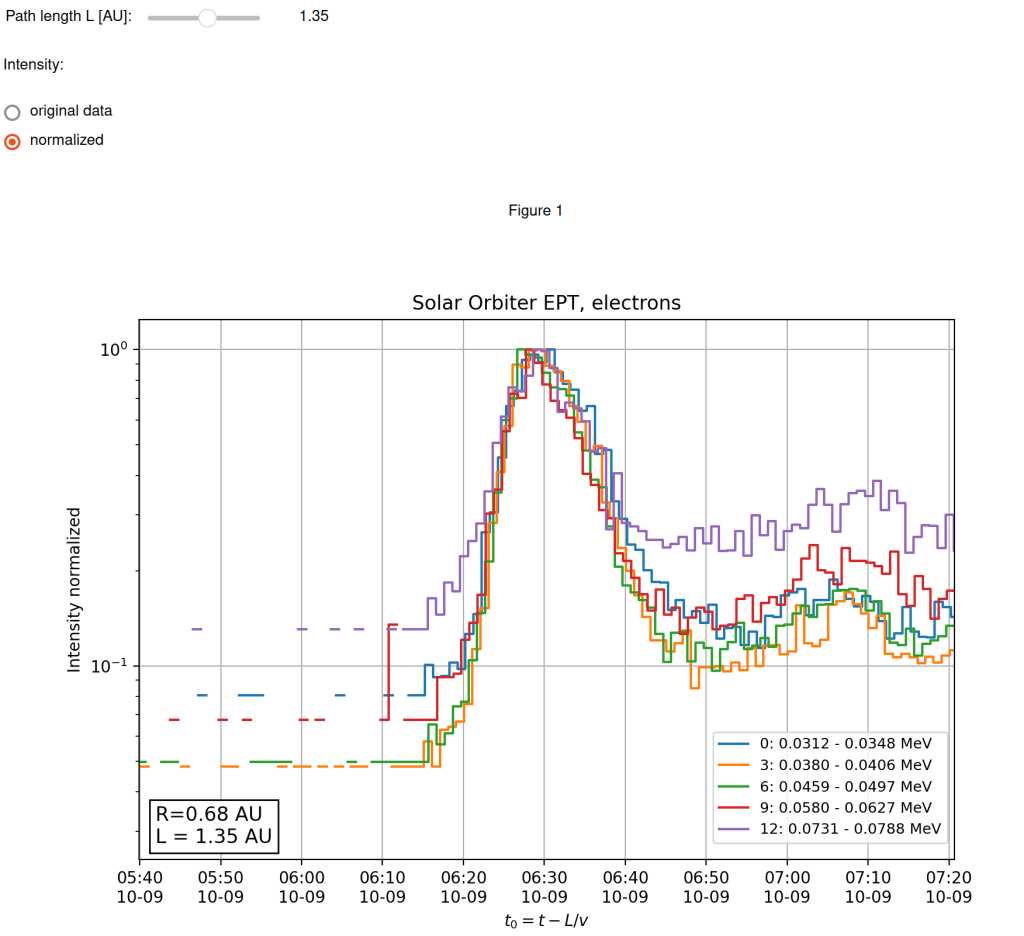
The purpose of this notebook is to interactively determine the solar release time for an SEP event observed in different energy channels.
It automatically obtains particle intensities of all energy channels for a given instrument, and provides the functionality to normalize all intensities and to assume a given path length that all particles have traveled. The intensity time series are then shifted back on the time axis by the time each would have needed to travel the given path length, depending on their different energies (i.e., speeds). With the assumption that all particles have been injected at the Sun simultaneously, it should be possible to find a “true” path length for which all time series collapse on each other, which also defines the inferred injection time.