
In research, usually every scientist is doing their own thing when it comes to data analysis. Most people rely on their own tools, written in their favourite programming language, or on some software they have been provided within their closed research group. Of course this limits scientific progress as everyone has to redo the same chores. Because of that, the SERPENTINE project aims to provide easy-to-use tools for advanced analysis and visualisation of solar energetic particle (SEP) events to the whole scientific community to facilitate maximum exploitation of the current heliospheric spacecraft fleet. This endeavour is carried out as open as possible, relying on the free and widely-used Python programming language, and developing all tools under an open-source licence and in public repositories. Thus, everyone can contribute, either by reporting bugs, suggesting features, adding functionalities, or just using the tools for free in their research. As part of this, a set of Jupyter Notebooks has been released that offers various tools in a simple manner, usable also for non-versed Python users:
- The energetic particle data loader Notebook consists of a collection of functions that simplifies obtaining SEP data sets measured by the current heliospheric spacecraft fleet (i.e., automatically downloading and loading into Python structures). In addition, the Notebook provides different examples on how to visualise these time series with Python. Versed users can then easily build their own analyses based on this.
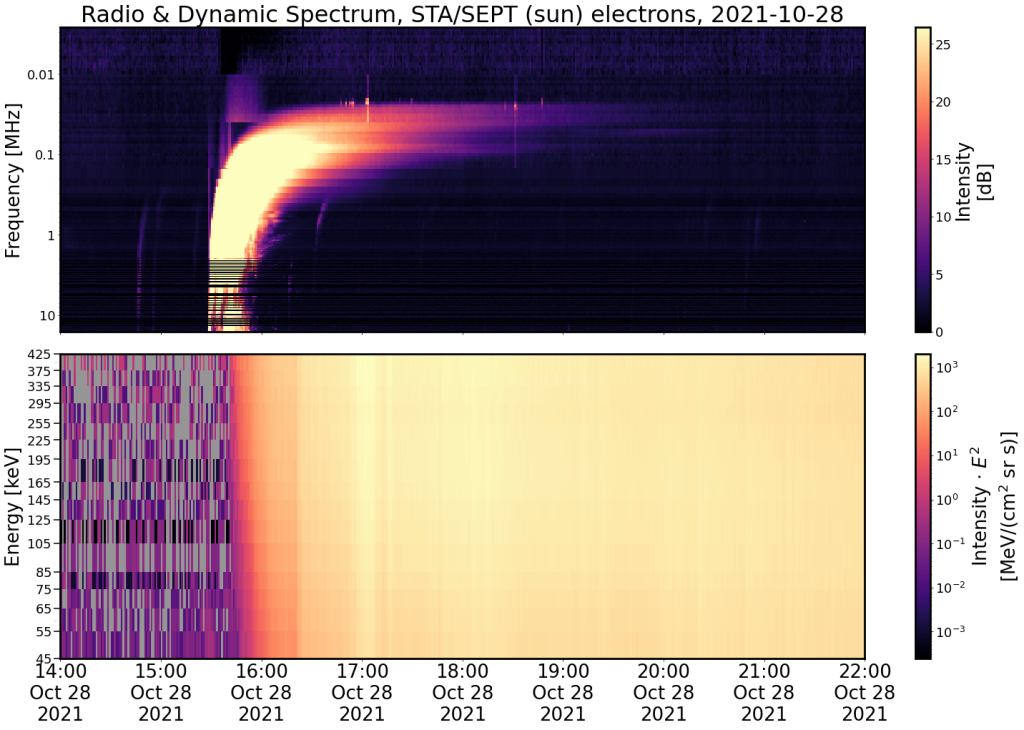
- The dynamic spectrum plotter offers an easy-to-use interface for selecting the mission, instrument, viewing direction, and particles species of interest, for which all needed data are automatically obtained. In addition, radio observations can be plotted on top that are also downloaded automatically.
- The onset determination Notebook uses the established Poisson-CUSUM method to automatically derive the onset times of an SEP event, while the time shift analysis (TSA) Notebook provides an interactive visual method to infer the solar release time for an SEP event observed in different energy channels.

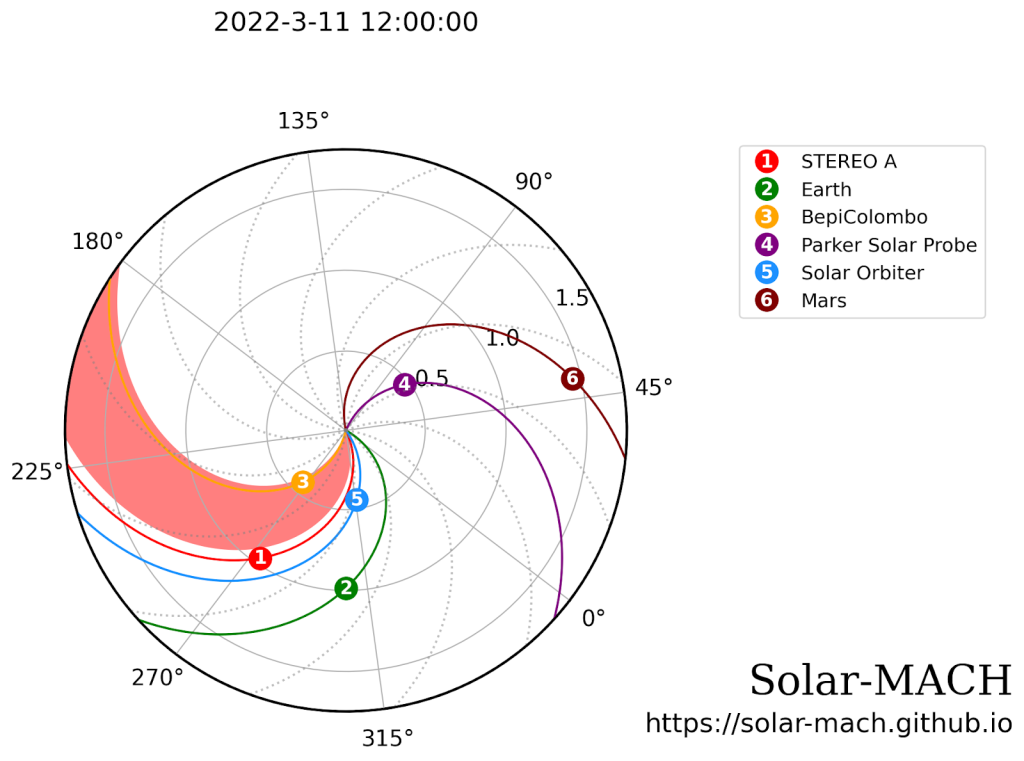
- The multi-spacecraft longitudinal configuration plotter Solar-MACH has undergone continuous development and has been enhanced with new functionalities. Next to the web tool available at solar-mach.github.io, it has been made available as an extensive Notebook that describes all functionalities and offers further enhancements using available Python packages. The Notebook illustrates for example how to visually highlight a region in the heliographic equatorial plane, add a set of background Parker spirals, generate an animated GIF file showing the development of the heliospheric spacecraft fleet over a given time period, or extend the magnetic connectivity analysis by a Potential Field Source Surface (PFSS) model.
All these Jupyter Notebooks are presented in the Tools section of this website and provided with step-by-step installation instructions in the corresponding GitHub repository. In addition, all of them can also be executed online on SERPENTINE’s JupyterHub server without needing anything else installed than a standard web browser